|
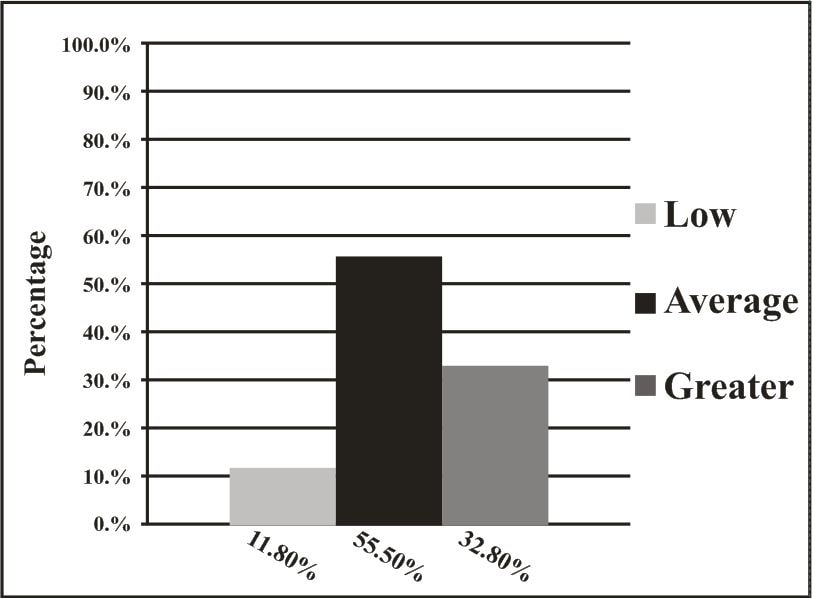
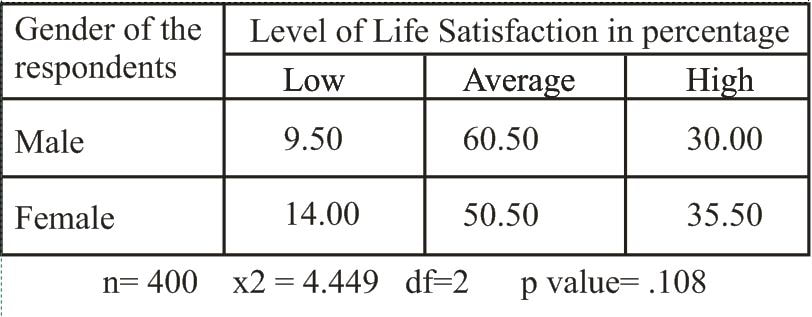
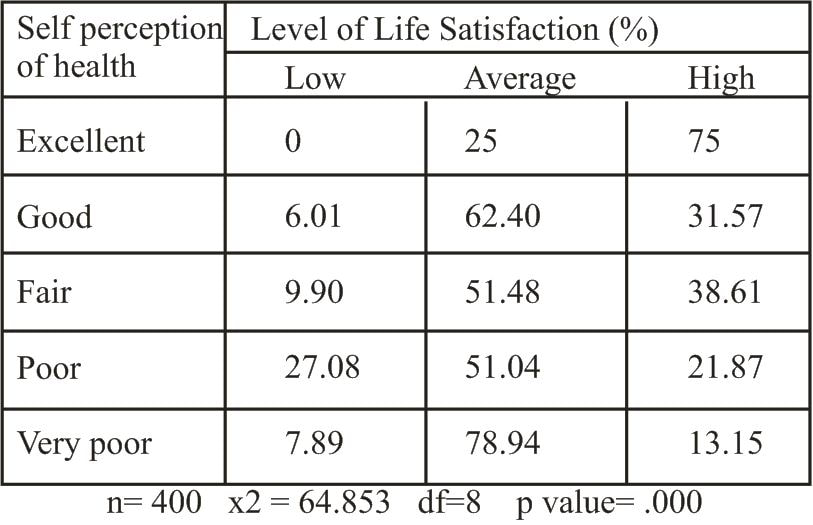
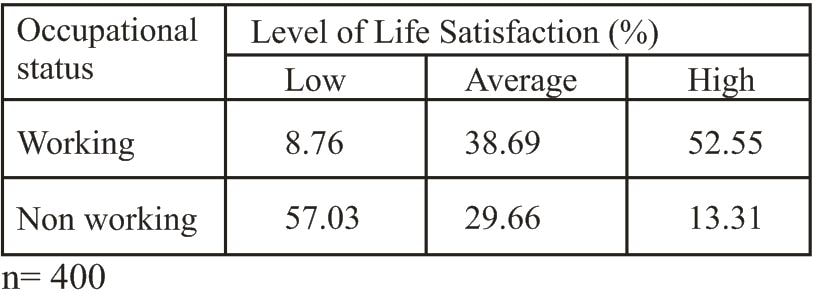
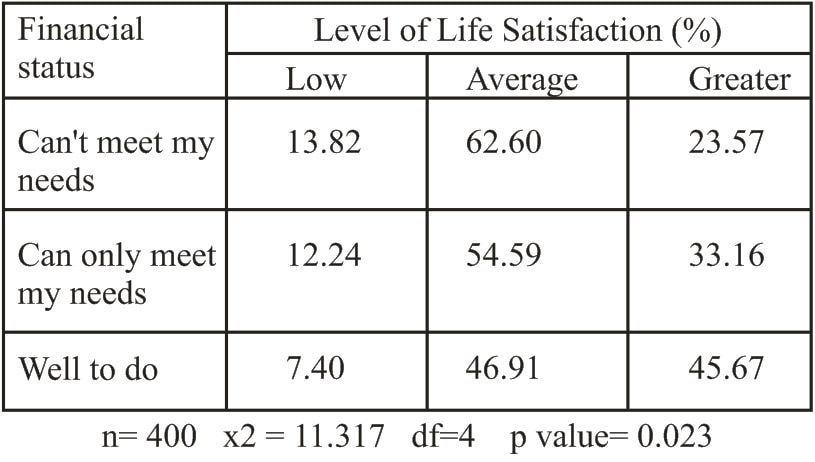
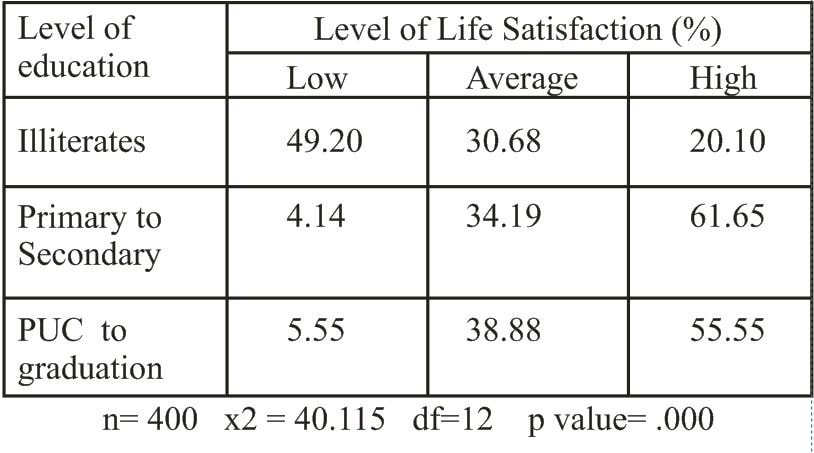
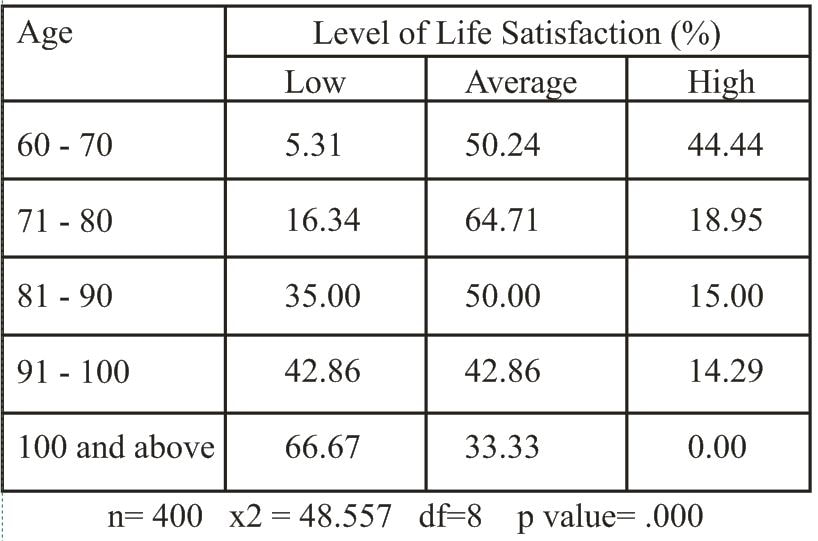
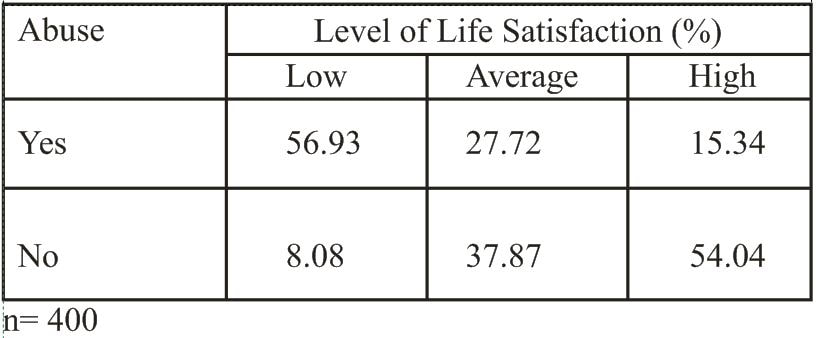
Old age is a closing period in life. It is a period when people move away from previous, more desirable periods or times of usefulness. As people move away from the earlier periods of their lives, they often look back on them usually regretting and tend to live in the past, ignoring the future as much as possible (Kuypers, 1972). Quality of life is an external quest for human being (Figueira, 2008) recognized as the individual perception of one’s position in life, both in the cultural context and the value system, related to the individual’s goals, expectations, patterns and worries, depending on satisfaction of social, economic, physical, emotional, psychological and mental conditions. Quality of life is conceptualized as generic, multidimensional parameters describing an individual’s subjective perception of his/ her physical or psychological health, as well as his/ her social function, environmental and general life status. Quality of life is a subjective wellbeing that reflects the distance between individual hopes and expectations and the effective experience (WHO, 2009). For the elderly quality of life is more than rating physical health status: emotional and social health are also important factors (Srapyan et. al., 2006). When the elderly experience that their aspirations are achieved they experience greater life satisfaction. Thus life satisfaction have a past orientation and an evaluation of how things are at the present. ife satisfaction is a research issue in social sciences in relation to ageing. Earlier life satisfaction was focused on pathology and coping with it, but later it was also used to understand the perception of quality of life. Life satisfaction is gaining increased importance in the field of gerontology. Researchers are attempting to understand the impact of physical disability, health status, role loss, diminishing social networks, modifications in activity involvement on quality of life of the elderly. Life satisfaction is the only one of the several competing subjective wellbeing assessment. Several studies have been done on the life satisfaction of individuals; of particular relevance in this context are the studies of Neugarten, Havighurst and Tobin (1961). They developed two scales to measure life satisfaction. They are Life Satisfaction Index A and B. These two scales are derived from life satisfaction rating which are the result of intensive clinical analysis. The scales have been validated. They measure the happiness and satisfaction of individuals in their present life. Hence for the present study Life Satisfaction Index A is used. This study attempts to understand the quality of life trough Life Satisfaction of the elderly in rural areas of five taluks of Dakshina Kannada district. The selected universe for the study is the elderly of rural Dakshina Kannada District of Karnataka State. The district is towards the costal belt of Southern India of Karnataka which covers 160 KMS of coastal belt. The district comprises of five Taluks namely Mangalore Taluk, Beltangadi, Sullya, Puttur and Bantval. The district is well known for its beauty, which is covered with Western Ghats in the east and bounded by the Arabian Sea in the west. The district consists of 20 towns and 354 villages. The total population of the district is 18,97,730 and among them 11,68,428 are residing in villages. The total population of elderly above 60 years of age in the district is 15,7,022 and among them 98,393 elderly reside in rural areas which constitutes the 8.42% of the rural population and 58,629 reside in urban areas (Govt of India, 2001). Importance is given to personal interpretation of life experiences of the respondents. The sample for th e study include all the elderly aged 60 years and above. The bedridden, mentally unsound and disable in speech were excluded from the study. A proportion of 400 elderly both male and female were drawn by systematic sampling method. A structured interview schedule and Life Satisfaction Index was utilized for data collection. Chart 1 Level of Life Satisfaction of the Respondents The above chart puts forth the level of life satisfaction among the respondents. It is found that 55.5% of the respondents are having an average level of life satisfaction. This indicates half of the respondents are neither having low level of life satisfaction nor greater level of life satisfaction. These respondents are inclining towards greater level of life satisfaction since they expressed that they have got pretty much what they have expected out of life. They also added that they feel sorry for the missed opportunities at their younger age yet they feel things seem to be better than they expected. However these respondents have an expectation that something interesting and pleasant things might happen in their life. Thishope and expectation gives an impression that the respondents have an average level of life satisfaction. 32.8% of the respondents felt that they have greater level of life satisfaction. These respondents believed in accepting life as it presents for them and take things in a positive sense. They added that apart from health and wealth, relationships and inner peace matters the most. These respondents do not worry of their past life because, the past can’t be changed. Instead they have planed their life and prepared themselves to accept their death. The remaining 11.8% of the respondents have expressed low level of life satisfaction. These respondents regret of making wrong decision in their life and hence have not achieved their aspiration. The respondent’s aspirations are not met because of too many family responsibilities and financial constraints. They experience lack of self fulfillment in life and regret for the past. Thus helpless thoughts and advancing age has developed pessimism about oneself. Thus the above table indicates that most of the elderly are inclining towards average level of life satisfaction. The respondents have realized age, past experiences and aspirations cannot be changed but only a positive attitude and inner peace would add sense of satisfaction during ageing. Table 1 Gender and Level of Life Satisfaction of the Respondents Table 1 analyses the sex difference among males and females in relation with the level of life satisfaction. The data shows that there is almost equal distribution between males and females in the level of life satisfaction. The analysis of the data through chi square test (x2 = 4.449) signifies no gender differences among male and female in relation level of life satisfaction of the respondents. One of the reasons supporting the findings of the above table is the agrarian society in rural Dakshina Kannada. The roles and responsibilities of males and females are complimentary. For instance the males do the task of ploughing and females clear the patch of land by removing stones, weeds, channelizing the water and manure the land. Another complimentary role identified in the field study is females collect the dry leaves and males carry them to the cow shed for converting it into manure. In case of cattle rearing the females cut the grass whereas the male carry them to feed the cattle. It is also observed that females milk the cow and the male take it to the dairy. Further the importance given to aged men and women in families is equal. Therefore the experience of interdependency in the roles and respect towards the elderly makes both male and female to attain proportionate level of life satisfaction. identified from the above table that three forth of the respondents with excellent self perception of health status have a greater level of life satisfaction. Besides this the respondents the other hand poor health status restricts the intake of certain foods creating a matter of concern and in turn affects their adjustment in the family. The health problems are also a cause of distressed psychological state leading to lower life satisfaction. When the health is perceived good it will influence the experience of life satisfaction. The self perception of health interferes in routine activities. Therefore the level of life satisfaction has a significant relationship with health status. Chi square assessment of the same table was significant with the result of x2 = 64.853, degree of freedom is 8 and the p value is significant. Hence the self perception of health status and life satisfaction has a significant relationship. Who rated their health on good, fair, poor and very fair majority have an average level of life satisfaction. Health is one of the indicators for increased level of life satisfaction. The life satisfaction depends on the achievement of their aspirations. A good self perception of health helps an elderly to have more time to think of attaining their aspiration. It encourages them to work even though as their age increases. Good health provides the elderly increased physical activity and are able to make better adjustment with oneself and with environment. Ill health is a cause of worry and preoccupies them with inabilities, medication and appointment with physicians. The good perception of health prevents them from dependency and gives them a sense of fulfillment. On the other hand poor health status restricts the intake of certain foods creating a matter of concern and in turn affects their adjustment in the family. The health problems are also a cause of distressed psychological state leading to lower life satisfaction. When the health is perceived good it will influence the experience of life satisfaction. The self perception of health interferes in routine activities. Therefore the level of life satisfaction has a significant relationship with health status. Chi square assessment of the same table was significant with the result of x2 = 64.853, degree of freedom is 8 and the p value is significant. Hence the self perception of health status and life satisfaction has a significant relationship. Table 3 Occupational Status and Level of Life Satisfaction of the Respondents The table highlights the occupational status and level of life satisfaction of the respondents. Though due to age related reasons elderly, do not prefer or are not allowed to work, there are some elderly who are forced to. Analyzing the level of life satisfaction based on occupational status, among the respondents working, only 8.76% have low level of life satisfaction and 52.55% have high level of life satisfaction. In relation to non working respondents, 57.03% have low level of life satisfaction and 13.31% have high level of life satisfaction. This data clearly denotes the reverse of percentages between the high and low level of life satisfaction among the working and non working respondents. The respondents working exhibited a sense of satisfaction of still being able to take care of their financial needs and supporting their family members. Most of the elderly are engaged in family occupation of agriculture, so they continue to work till they are able bodied. The working respondents feel that they are utilizing their time and spend no time wisely being idle to be preoccupied with worries. Therefore the working status kept them feeling young in spirits and upheld the sense of satisfaction in life. Table 4 Financial Status and Level of Life Satisfaction of the Respondents The above table analyses financial status and level of life satisfaction of the respondents. As per the results found in the table, the respondents with well to do financial status are having greater level of life satisfaction. On the other hand the respondents with difficulty in meeting their needs and partially able to meet their needs have average level of life satisfaction. Better financial status helps the elderly to meet their ageing health needs like medication and supplementary nutrition. Higher financial status makes it possible for the elderly to maintain contact with people far away. It also helps them to fulfill and materialize. The elderly having financial constrains find it difficult to give gifts to their loved ones and feel guilt for only receiving gifts from the loved ones. The availability of money in old age helps them to attain a sense of security. Therefore there is significant relationship between financial status and level of life satisfaction. Table 5 Age and level of life satisfaction of the respondents The above table studies the relationship between age and level of life satisfaction among the respondents. The table reveals that 44.44% in the age group of 60 to 70 years have a greater level of life satisfaction. As observed in the age group of 71 to 80 years the percentage of greater level of life satisfaction of the respondents is reduced to 18.95%. Likewise in 81 to 90 years the percentage is 15. Further observation reveals downward trend and finally none of the respondents in the age group of 91 - 100 and above years have greater level of life satisfaction. The reverse is true on the opposite level of life satisfaction. Among the respondents reporting low level of life satisfaction there is progress in the percentages as age increases. Therefore it can be said that as age increases the level of life satisfaction decreases. The decline of life satisfaction among the old old is attributed to the physical and psychological effects of ageing. Similar trend is also identified by Ramamurti (1970) that there is a decline of life satisfaction as age increases. She also added that this phenomenon was due to the decline in the early period of aging due to the effect of changed roles and at the later stage of aging, it was attributed to the decline in physical and psychological status. Hence age is an important criterion influencing the level of life satisfaction. Table 6 Level of education and level of life satisfaction of the respondents The above table attempts to draw relationship between the level of education and level of life satisfaction of the respondents. Among the illiterate respondents 20.1% have a greater level of life satisfaction. Among the literates with primary to secondary level of education 61.65% have greater level of life satisfaction. Similarly those with PUC to graduation 55.55% have greater level of life satisfaction. The table shows a difference between illiterates and literates. As per the exploration in the field study it is noticed that there is dissimilarity in the view points, life style and interests jobs as compared with lower educated counterparts. The life style and practices have also an impact on their quality of life. between these two groups. The literates seemed to be well informed about the physical, psychological and social changes due to ageing. This has prepared them to accept the changes, to take better care of themselves and take precaution to avoid early signs of ageing. The educated are able to engage in better income jobs as compared with lower educated counterparts. The life style and practices have also an impact on their quality of life. The chi square test (x2 = 40.115; p value= .0000) identifies the significant relationship between level of education and life satisfaction. Hence this indicates that education has a positive impact on level of life satisfaction and cross validates with Anathraman (1970). Table 7 Feeling of being abused and level of life satisfaction of the respondents The above table presents the feelings of abuse and level of life satisfaction of the respondents. Among the respondents experiencing abuse 56.93% have a low level of life satisfaction, whereas among the respondents not experiencing being abused majority of 54.04% have high level of life satisfaction.
For the aged physically it is challenge as they decline in strength. They also have financial constraints and psychologically they need support and understanding. In such instance they develop dependency on their family members. This dependency is considered natural by some families who compensate and reciprocate feelings of the elderly. But all the elderly do not experience the same, as this helplessness is taken advantage of and exploited. In the present study among the respondents who are being abused, although they have realized being abused they cannot counter react since they have no one to depend up on for fulfilling their needs. This experience of abuse blocks their peace of mind, well being, desires, interest and needs. Therefore it creates dissatisfaction within oneself and with their surroundings leading them to low level of life satisfaction. Conclusion: In conclusion introspecting into life satisfaction along gender lines of the respondents reveals that there is no difference between male and female respondents. There is no much variation between males and females in the role performance, life style and they are treated with the same respect and reverence. Focusing on life satisfaction and health status of the respondents there exists significant relationship, because the health status has obstructed in attaining achievement and aspirations. The ailments do interfere in their day –to- day living. Life satisfaction with regard to working respondents was found to be higher than the non-working elderly. There prevails a significant relationship between financial status and level of life satisfaction. The financially well to do respondents have a higher level of life satisfaction, since they could afford to meet the expenses to satisfy their needs especially comforts and better standard of living. There is a downward trend on the level of life satisfaction as age increases. This is due to changing roles in early years of old age and later it is attributed to decline in physical and psychological status. There is a significant relationship between the level of education and the level of life satisfaction. The educated elderly are aware of ageing and thus able to accept the physical, psychological and social changes during old age. The study signifies that the elderly experiencing abuse have an adverse effect on their level of life satisfaction. Bibliography:
Dr Ajith J D’ Souza, MSW, M Phil, PhD Dean Post Graduate Department of Social Work, Milagres College, Kallianpur, Udupi |
Categories
All
Social Work Learning Academy50,000 HR PROFESSIONALS ARE CONNECTED THROUGH OUR NIRATHANKA HR GROUPS.
YOU CAN ALSO JOIN AND PARTICIPATE IN OUR GROUP DISCUSSIONS. MHR LEARNING ACADEMYGet it on Google Play store
|
SITE MAP
SiteTRAININGJOB |
HR SERVICESOTHER SERVICESnIRATHANKA CITIZENS CONNECT |
NIRATHANKAPOSHOUR OTHER WEBSITESSubscribe |
MHR LEARNING ACADEMY
50,000 HR AND SOCIAL WORK PROFESSIONALS ARE CONNECTED THROUGH OUR NIRATHANKA HR GROUPS.
YOU CAN ALSO JOIN AND PARTICIPATE IN OUR GROUP DISCUSSIONS.
YOU CAN ALSO JOIN AND PARTICIPATE IN OUR GROUP DISCUSSIONS.
|
|



 RSS Feed


